Market Overview
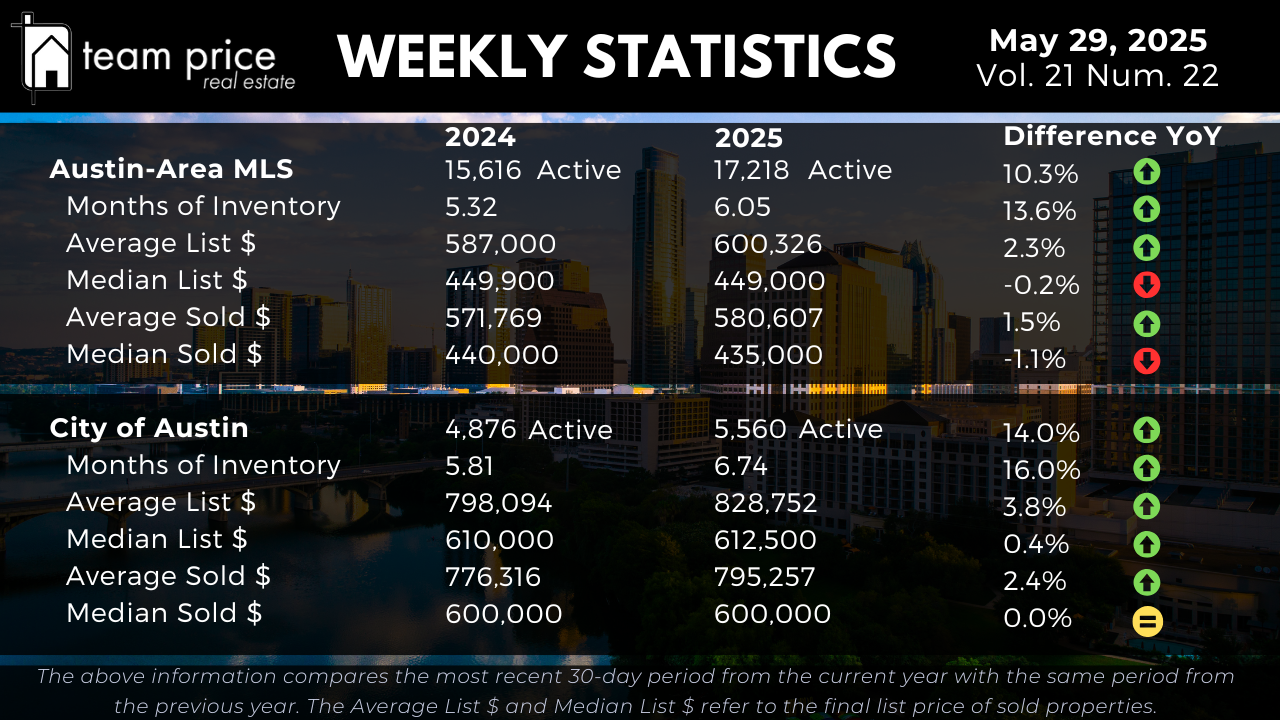
As of May 29, 2025, the Austin-area MLS is reporting 17,218 active listings—a 10.3% increase compared to this time last year. Months of Inventory has also risen from 5.32 to 6.05, marking a 13.6% increase and reflecting a notable shift in market balance. This increase in available homes gives buyers more options and slightly more leverage than they’ve had in recent years. Within the City of Austin, inventory has grown even faster, up 14.0% year over year to 5,560 active listings. Months of Inventory there now stands at 6.74, up from 5.81 in May 2024, confirming a 1.2x increase. These figures reflect a slower absorption pace and suggest a market that remains in correction.
Pricing Dynamics in Austin Real Estate
Home prices in the Austin-area MLS show mixed movement. The average list price is up 2.3% year over year to $600,326, while the average sold price has increased 1.5% to $580,607. However, the median sold price declined slightly—down 1.1% from $440,000 last year to $435,000. The median list price also dipped marginally by 0.2% to $449,000, indicating that while top-line averages are being supported by higher-end properties, overall pricing pressure remains in the lower and mid-tier segments.
In the City of Austin, price stability has been more evident. The average list price rose 3.8% year over year to $828,752, and the average sold price climbed 2.4% to $795,257. The median list price inched up to $612,500, and the median sold price held steady at $600,000—unchanged from a year ago. This relative stability reflects a market where well-priced homes continue to attract steady demand, particularly in higher-income neighborhoods.
City and Regional Dynamics
Across the 30 cities tracked in Central Texas, pricing remains highly local. This month, 14 cities (47%) saw month-over-month price increases, while 15 cities (50%) recorded declines. Year over year, just 9 cities (30%) showed price growth, while 21 cities (70%) posted annual declines. Notably, none of the cities are priced above their 12-month peak—100% remain below.
Looking at the 75 zip codes monitored in the region, 34 zip codes (45%) showed monthly gains, while 40 (53%) declined. Year-over-year, 25 zip codes (33%) saw price increases, while 50 (67%) experienced declines. Only one zip code remains priced above its 12-month high. This widespread trend underscores the broad-based nature of the market correction, especially in areas that had seen the fastest appreciation during the pandemic era.
Sales vs. List Price Analysis
So far in May 2025, 62.87% of homes sold below the list price, a slight improvement from 62.97% last month. Meanwhile, 22.21% of homes sold exactly at list price, and 14.92% sold over asking—down from 16.81% during the same period last year. The average sold-to-list price ratio is now 97.77%, indicating that while buyers are still negotiating, sellers are holding close to their list price when offers are strong and pricing is aligned with current market conditions.
Peak Value Analysis: Austin-Area MLS
The Austin-area MLS remains significantly below its peak market values. The average list price reached a high of $726,068 in April 2025 but has since declined by 4.7% to $692,035. The median list price is now $484,995, down 10.2% from the May 2022 peak of $539,900. The average sold price has dropped 12.0%, from $664,515 in May 2022 to $584,682 today. The median sold price has declined even more sharply—down 18.2% from $538,000 to $439,900. Price per square foot figures reflect the same downward trend, with the average dropping 20.1% from $324 to $259, and the median down 21.4% from $280 to $220.
Peak Value Analysis: City of Austin
The City of Austin shows a similar, though slightly more resilient pattern. The average list price peaked at $964,801 in April 2025 and has since fallen by 6.9% to $898,235. The median list price has dropped 11.1%, from $675,000 to $599,900. While the average sold price remains relatively strong—down 5.9% from its May 2022 peak of $847,583 to $796,973—other indicators point to broader market pressure. The median sold price has decreased 11.8%, from $680,000 to $600,000. Average price per square foot has fallen 18.1%, from $442 to $362, and the median is down 19.3%, from $393 to $317. These numbers suggest that while premium homes are still performing, the broader Austin market continues to adjust.